
Context
This case study aims to present the process of using Generative AI for descriptive analysis, a type of data analysis that focuses on describing, summarising, and presenting data meaningfully. It allows possible patterns to emerge while ensuring all conditions of the data are met.
This is part of an assignment for the Advanced Human-Computer Interaction class at UQ, where my team aims to understand the language barrier issues often encountered by many international students in Australia. The course’s task is doing descriptive analysis using GenAI.
While my team is collaborating on the end-to-end process, this data analysis component is solely my own work and responsibility.
Objectives
01
Use descriptive statistics to summarise the data and perform segmentation to identify patterns and insights.
02
Produce data visualisation
Limitation
Limited amount of survey responses and variability of respondent’s background.
Process
My work process is described in the diagram below.

Step 1
Using Generative AI to check potential correlations between survey questions
Firstly, it is important to brief the GenAI about the research context. It could be our theme (e.g., health, education, etc.), problem statement, objectives, or other parameters that we like. This would allow the AI to be ‘kept within the lines’ and understand what we want better.
Secondly, you want to tell the AI about the type of data that you have and what you want to do with it. If it’s a survey, then you want to prompt that the data is a CSV file containing survey data that has N number of questions. When analysing survey questions, it's important to clarify the type of responses they choose (ie. Likert scale, multiple choices, binary, etc.). Understanding these types helps in tailoring analysis and extracting meaningful insights from survey data.
Tip: If you have a separate PDF file containing the research brief and empty survey (which showcase the questions and the answer options), you can also attach it in the conversation. This way, you don’t have to explain things in overly detailed in the AI.
This is the prompt I gave to the AI to read the survey data:
Sample AI prompt:
I am working on a CSV file from a survey to create a quantitative analysis. For the context, this is a survey that I created for a user research to understand the language barrier issues often encountered by many international students in Australia. The objective of this research is to do descriptive analysis of the survey data to find possible patterns.

These are the survey questions:

1. Whats your primary language
2. What is your primary language?
3. What language you are struggling the most?
4. How frequent do you encounter issues related to language difficulties?
5. In which of the following contexts have you encountered language barriers? (Select all that apply)
6. What kind of activities that you think are challenging the most in term of the language barriers?
7. "Please explain the experience (What emotions did you feel? What actions did you take to overcome the situation? etc.)
8. "Please describe on how you overcome that problem?
9. What types of technology do you use to overcome language barriers? (Select all that apply)
10. What are your typical emotional responses when facing a language barrier?
11. How frequently have language barriers influenced your decisions in social or professional settings?

I need you to create the possible correlations and the type of visualisations for the statistics. Create your answer in a table.
Generative AI output
Important: ChatGPT can make mistakes. Do critically review the output and see if it makes any sense. Sometimes what it suggested did not make any sense (or was even wrong), so creating better prompts while describing context AND critically review it is absolutely crucial 🙂
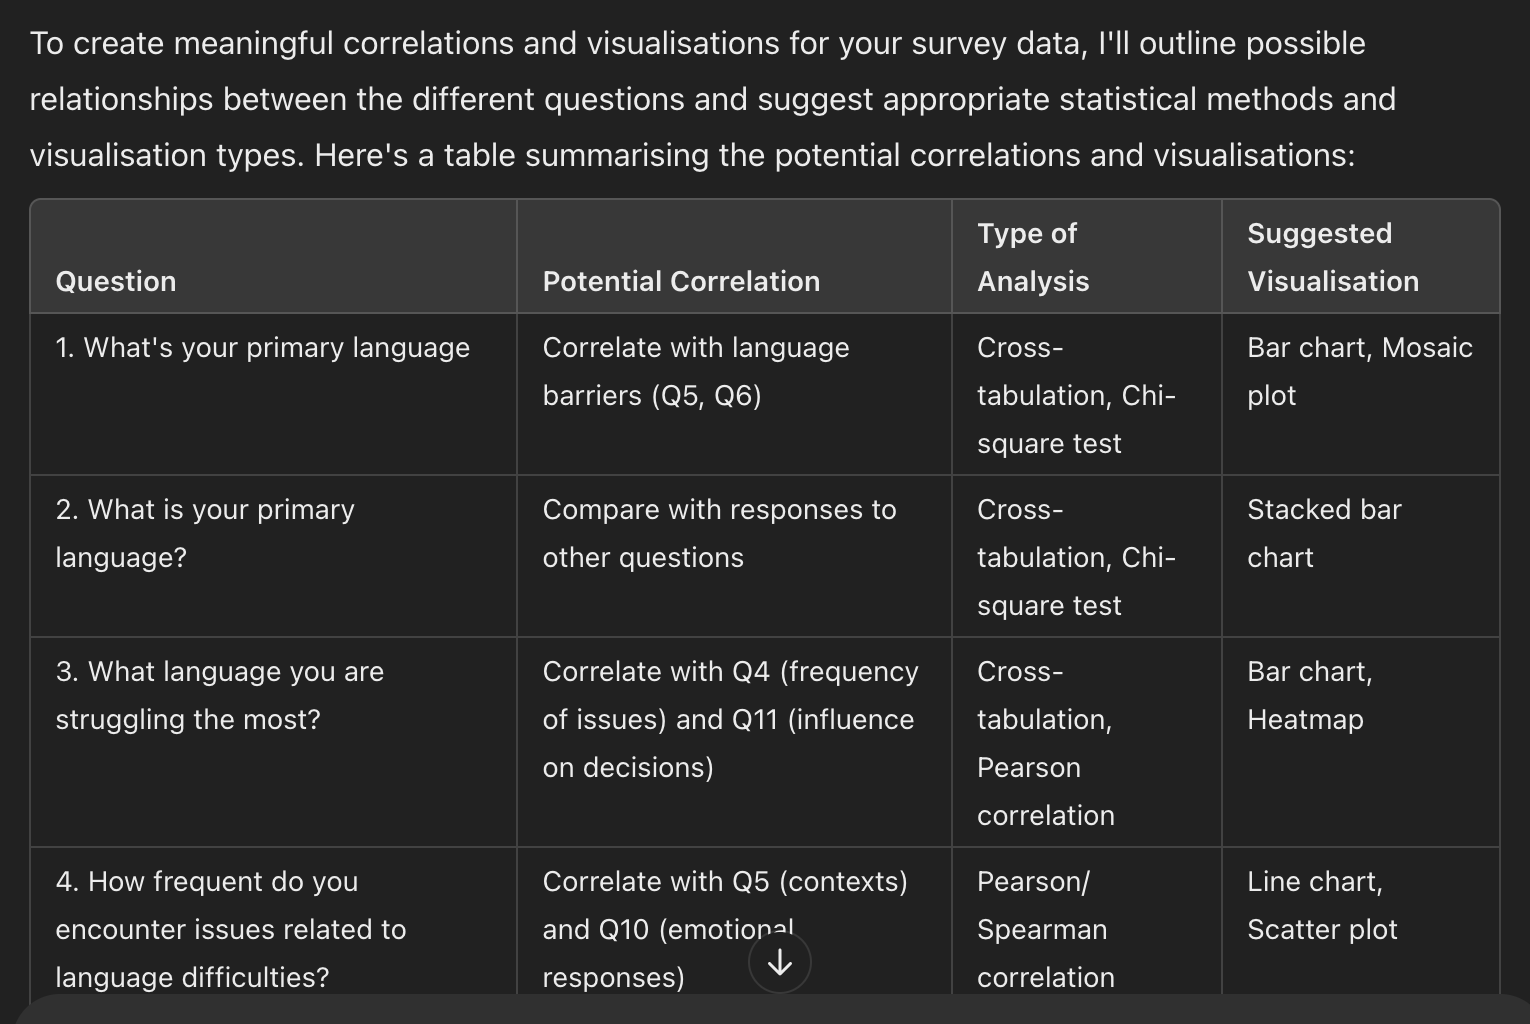
The result of correlations table, generated by ChatGPT 4.0, showing columns of questions, potential correlation, type of analysis, and suggested visualisation.
If any of the above sounds alien to you (like what on earth is Pearson correlation 🤯), you can also ask ChatGPT to describe it back you. Following figure shows ChatGPT’s explanation for each visualisation type to make sure you are choosing the appropriate ones.

02
Create Python code to run the survey data
Programming allows us to run the same code multiple times to check different possible correlations, making the data analysis faster and much more accurate than just trusting our gut.
The code is unique to the survey data CSV file that it will read. Additionally, the libraries are also depend on the type of test we run. In my case, here I imported the libraries Pandas, Matplotlib, Seaborn, and SciPy. You can always ask ChatGPT about their function, as seen in the second image below.

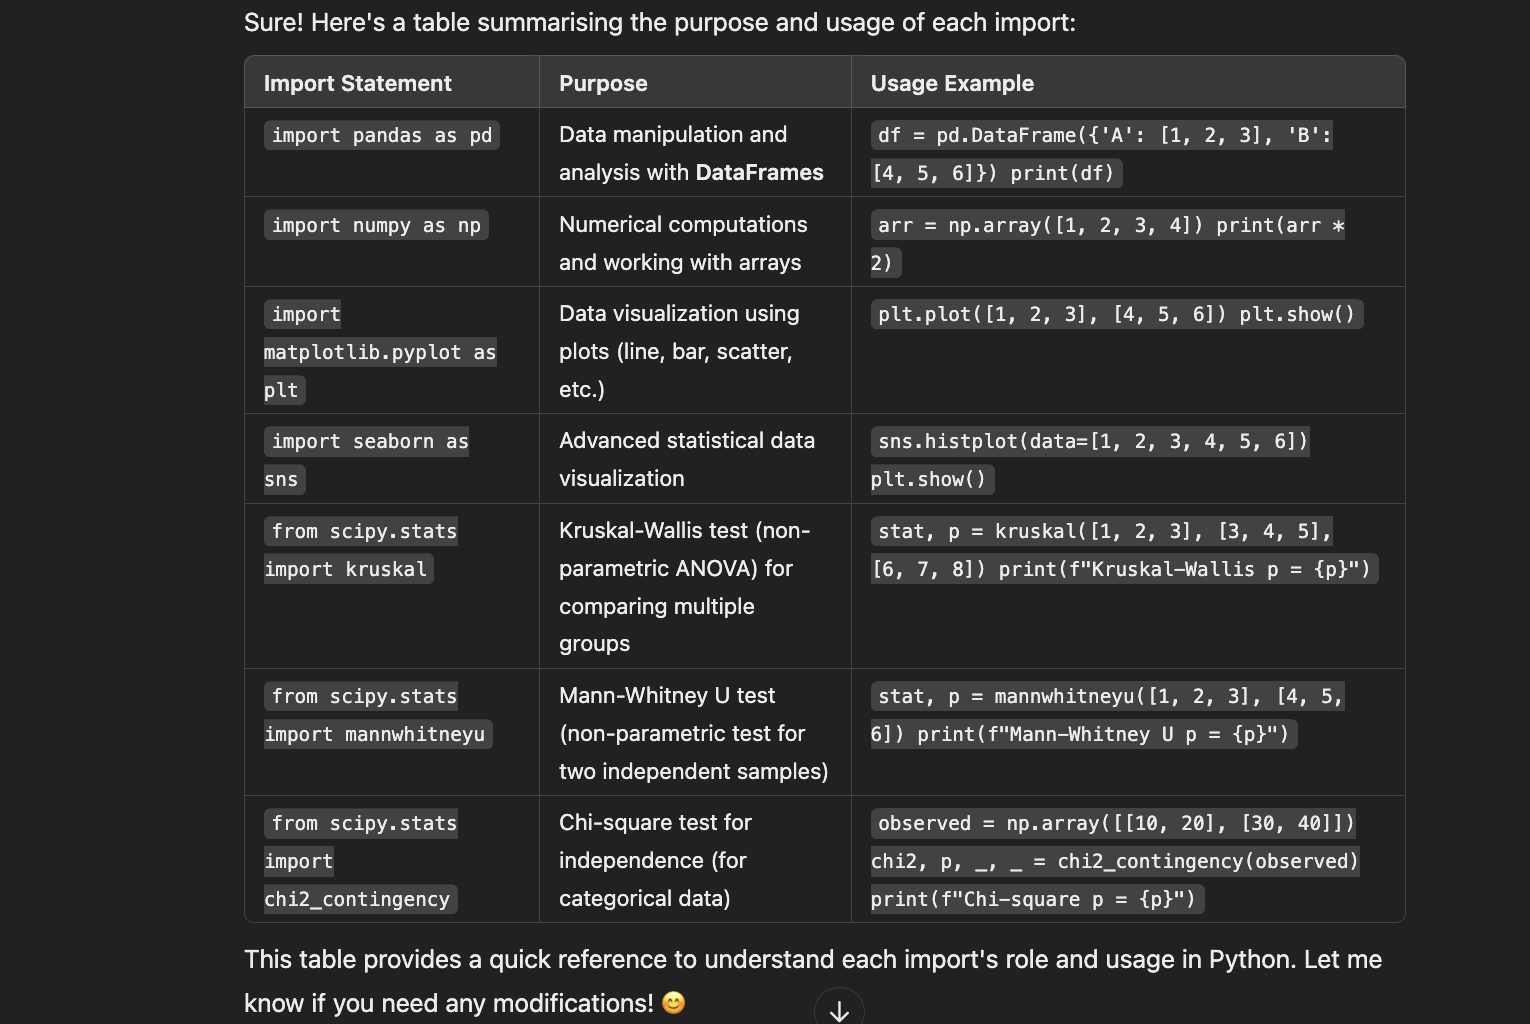
As I said previously, the code is unique to the data content in the CSV. So, I won’t be explaining the code lines by lines. But I put my code in GitHub if anyone wants to check it out: https://github.com/ratnamukti/deco6500_descriptiveanalysis 🫣
My code itself is not really good either with a lot of inefficient method and redundancy because I need to get the output fast due to the deadline. Fortunately, the course was not focusing on code quality, but rather focusing on how well we use GenAI to advance our data analysis process.
I started by gathering the data, cleaning it up, and standardizing the text so I could run tests using functions. I added comments to my code for clarity.
alternative way
We can ask ChatGPT to generate the whole Python code for us. After we got the code, all we so need is to upload the survey data file and, voila, it’s done. But, make sure you critically review it as ChatGPT cannot be 100% reliable.
I will run the code online using Google Colab, so that anyone without code text editor not Python installed to their computer can also try it.
Sample AI prompt:
You are my programmer. I need you to generate a python code to run in Google Collab that can recieve file import (such as CSV) of the survey data, then run analysis and create visualisations as described in 'Quant analysis helper table.docx'. My survey data is attached called 'surveydataEN.csv'.

I need you to also create in-line comments in the code to describe what it does. Including which survey questions that it tests (example: Q4 and Q9 for.. using ..)
From my own personal experience, it might takes several iterations of updating the code to make it work the way i want. That is because sometimes you will get errors.
Still in the same conversation window in your ChatGPT (or any other GenAI of your choice), simply copy the error message and paste it back to the AI conversation. In my case, it will read the error for you and fix the code for us.


03
Reading the results
After I got the results from running the Python code, I uploaded the data visualisation and chi-square test calculation results to ChatGPT 4.0 and asked what the implications are.
Some samples of the results are as follows:
[Q4&Q5]
Frequency of Encountering Language Difficulties by Context
Legend for frequency:
(1) Never, (2) Rarely, (3) Occasionally, (4) Frequently, (5) Very Frequently.

This stacked bar chart indicates that the highest frequency of language difficulties is reported in the context of social settings and travelling, with fewer difficulties encountered in educational activities and work settings. This indicates a situation where individuals need to use a language that is not their native, particularly English, to speak with locals.
[Q0 & Q4]
Impact of Education on The Frequency of Language Difficulties

The plot indicates that those with a bachelor's degree (as their latest education) experience the highest variability in the frequency of language difficulties, while those with postgraduate degrees report fewer difficulties, suggesting a possible link between higher education and a reduced frequency of language difficulties.
[Q6 & Q9]
Correlation between Challenging Activities and Technology Used

The graph indicates that for activities like "Conversing with friends or team members" and "Doing the assignments," people are more likely to use online forums or community groups, social media platforms, and translation apps. It highlights which technologies are most used in various challenging situations.
Chi-Square Test for Q4 and During Educational Activities
From the three results above, it seems the issue is prevalent in classroom settings, especially for the international undergraduate students, where their experience conversing in English is probably less than those with higher degrees and experience.
To test this assumption, I use Chi-square test for Q4 responses
The Chi-square statistic of 10.424 is significant (p-value = 0.015), indicating a statistically significant association between the frequency of encountering language difficulties (Q4) and the context of "During educational activities."
Meaning: There is a significant relationship between how often individuals encounter language difficulties and their experiences in educational settings. Those who frequently face language difficulties are likely to encounter them during educational activities.
Synthesis
There’s a common pattern regarding the language barrier issues and educational activities found in the four examples above. Based on holistic findings, we decided to narrow our focus to specific context: education (classroom conversations, lectures, worksheets, etc.)
Key takeways
How does GenAI help in UX research data analysis?
This process allows us to test our assumptions and find correlations between questions (and findings) that could not be easily found otherwise.
Help in narrowing down my research and find the specific domain to solve. For example, this research begins with a very broad idea of language barrier issues. From many contexts—education, travelling, culinary, etc.—we can narrow down to focus on classroom issues, making our potential solution more specific towards it.
Help make data analysis faster
