Context
What if you, a woman, want to stay vigilant with your surroundings and keep yourself safe from possible crimes?
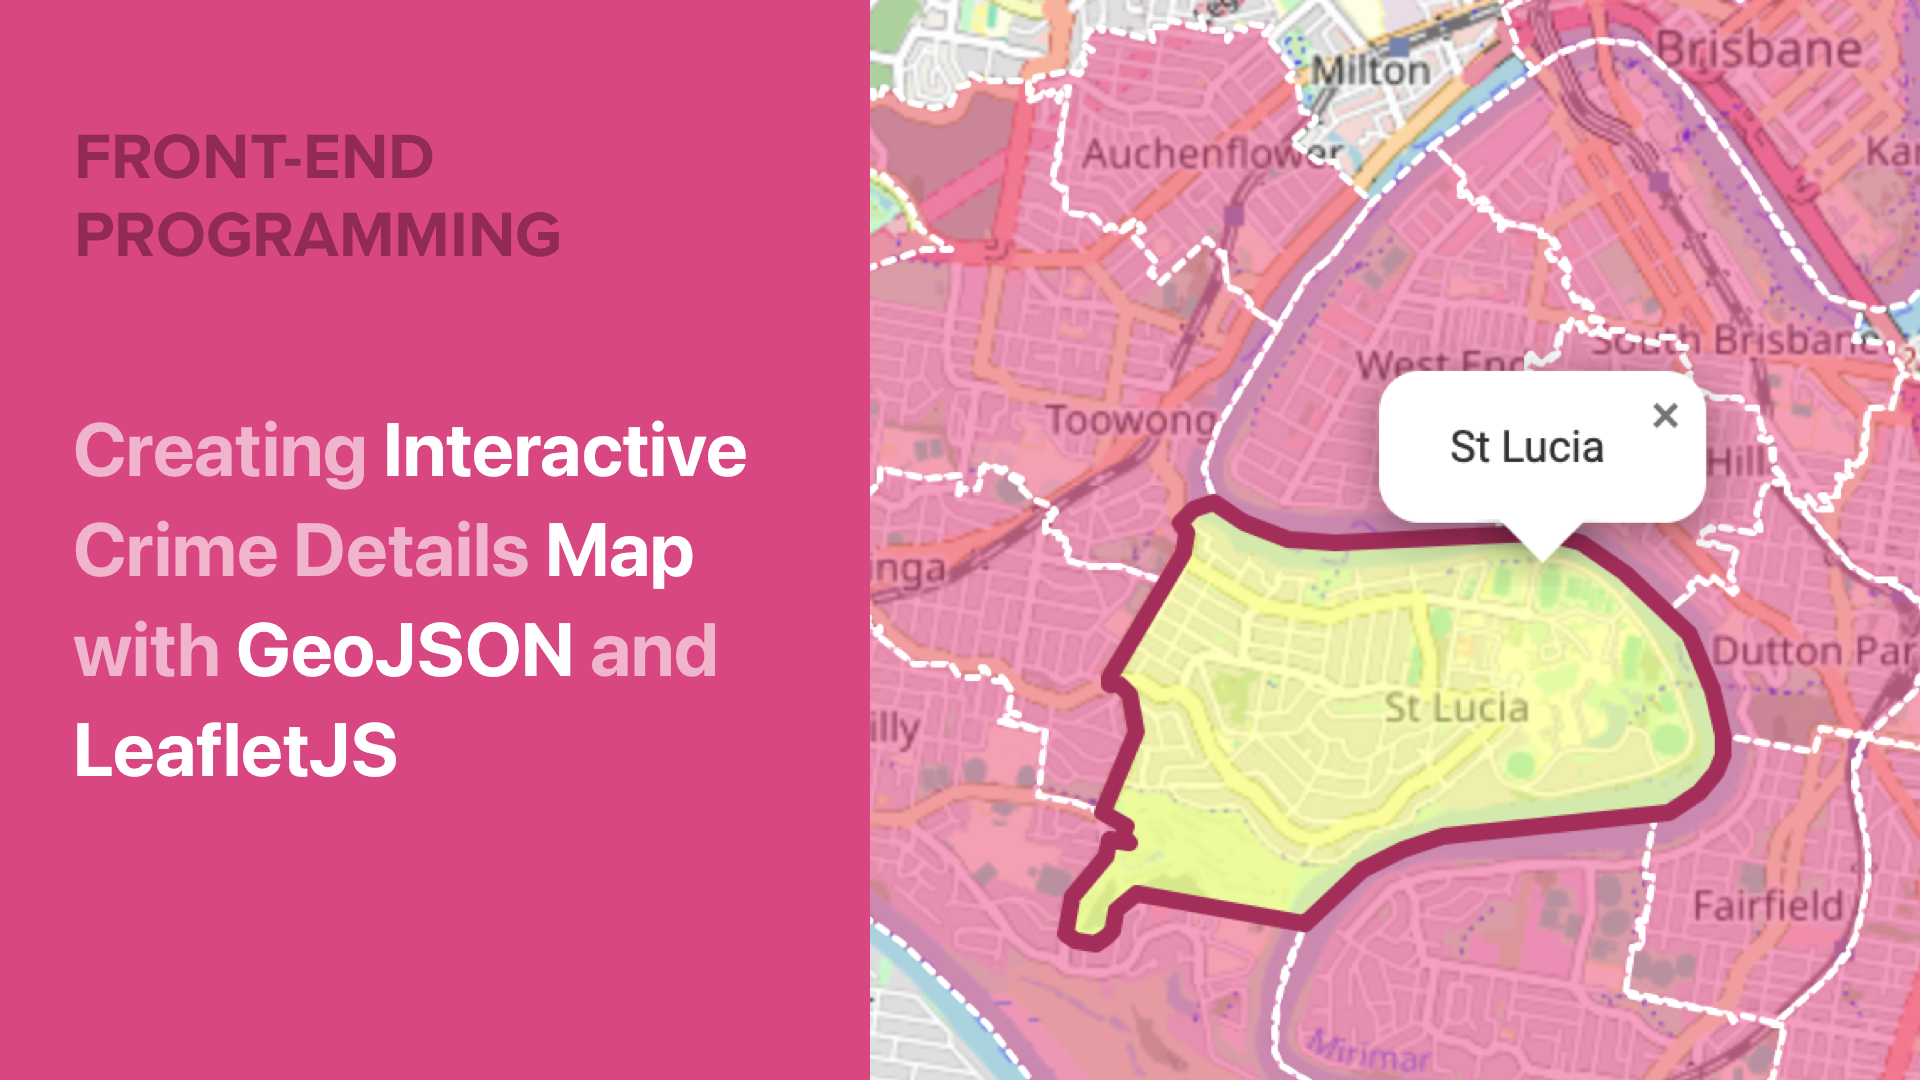
As a part of the Design Computing Studio course at UQ, I created an interactive crime map to help women be aware of their surroundings by interactively checking out the crime cases and number of incidents happening in Brisbane suburbs.
The aim of this page is to show the programming steps I took to produce the interactive choropleth map and not about the UI/UX design.
Specification
Year: 2023
Duration: 6 development weeks
Role: Frontend engineer (API)
Programming STACK
HTML, CSS, JavaScript, JSON
My Role
I handle APIs, create the crime map, and fetch data from the Queensland government open data portal.
Preview
Objectives
01
Create the interactive map with Brisbane as the center point, so it shows the city when the website opens.
02
Show crime data for Brisbane suburbs by clicking on a suburb area on the map to see its crime details.
Process
My work process is described in the diagram below.

Step 0
Find the datasets for the crime map
To create the map, I need two kinds of dataset:
dataset to get crime data of the suburbs
dataset is to display the geo boundaries on the map that shows the boundaries of each suburb area
Luckily, both datasets are available at the Queensland Government Open Data Portal: https://www.data.qld.gov.au/dataset/crime-locations-2000-present/resource/3a1448e0-649b-4b7c-813b-a5a5bb8ea14e
From that document, we got the Crime Map API URL at: https://a5c7zwf7e5.execute-api.ap-southeast-2.amazonaws.com/dev/lut
Which will open a JSON file as follows:

This dataset is amazing because it provided us with a variety of ways to look, search, or filter the data, including by suburb, postcode, local government area, etc. I am using ‘Suburb’ class for this project as it match with my goal.
This is the table in the dataset documentation, providing information on how to lookout the data:

Source: Queensland Government Open Data Portal
Step 1
Fetch crime details based on suburbs
Firstly, without creating any map, I want to test whether my code can fetch data based on suburb. So, I hardcoded the suburb names as buttons that instantly append the API URL with its name.
Example suburb button: “Toowong”
Return: All crime data happening in the suburb of Toowong.
✅ How to do it?
Remember the Crime Map API URL I mentioned in Step 1?
https://a5c7zwf7e5.execute-api.ap-southeast-2.amazonaws.com/dev/lut
We need to change the tail from “lut” to “location” because we want to filter the data based on location:
https://a5c7zwf7e5.execute-api.ap-southeast-2.amazonaws.com/dev/location
Then, we need to specify that the location type would be suburb name. Not by district or patrol group, for example. To do that, I appended “/locationType=SUBURB” at the tail of our API URL above:
https://a5c7zwf7e5.execute-api.ap-southeast-2.amazonaws.com/dev/location/locationType=SUBURB
Next, I am going to hardcode the suburb name based on the suburb button “Toowong”, so the crime data of Toowong suburb will be returned when the “Toowong” button is clicked. To do that, I again appended “/locationName=’Toowong’ at the tail of the same API URL:
https://a5c7zwf7e5.execute-api.ap-southeast-2.amazonaws.com/dev/location/locationType=SUBURB&locationName=’Toowong’
This API call will fetch all crime that occurs in Toowong suburb in JSON format.
✅ OUTCOME

To automate the modification of the API URL, I use buttons to represent the suburbs.
Each button was given an HTML properties ‘class’ and ‘value’ with their corresponding suburb name. For example, in the HTML:
<li><button class="suburbButton" value="toowong">Toowong</button></li>
And in the JavaScript, simply add getElementsByClassName to call the button class property and create an eventListener to the click to get the target’s suburb name property (value).
So, the URL will dynamically change depending on which button is clicked.
I added start and end dates as well into the parameter.
getoffenceapi = 'https://a5c7zwf7e5.execute-api.ap-southeast-2.amazonaws.com/dev/offences?locationType=SUBURB&startDate=01-01-2022&locationName=' + value + '&endDate=12-31-2022&format=JSON'
Step 2
Create a popup to show the top 3 crimes in the selected suburb
To do this, I created JavaScript files that both process + filter the dataset and contain the string inside a popup. My logic was:
Get offence types in the selected suburb
Sort by number of occurrences
Get the top 3 crimes, and then
Contain them inside a popup
✅ How to do it?
Firstly, turn the data from the API response into objects. In data structure, the offence type is the 'key’ so that we can easily find the number of occurrences as the ‘value’.
Secondly, I also need to count how many times each offence occurs and deal with cases where a crime type doesn’t happen in the chosen suburb, as not all crimes occur everywhere. So, if multiple offence types (ie. theft) were printed twice on the JSON, then an array called count_offences would be incremented, making that offence type’s value = 2. If printed four times, then value = 4, and so on.
At the same time, flagging the crime type that does not occur in the result will make sure that it will not be printed.

View more on my GitHub: https://github.com/ratnamukti/deco7180-interactivecrimemap/blob/main/suburblistscript.js
Thirdly, I want to be able to sort descendingly based on the number of offences and then get the top three highest occurances in that suburb. I just followed the sample code from w3schools as seen below:
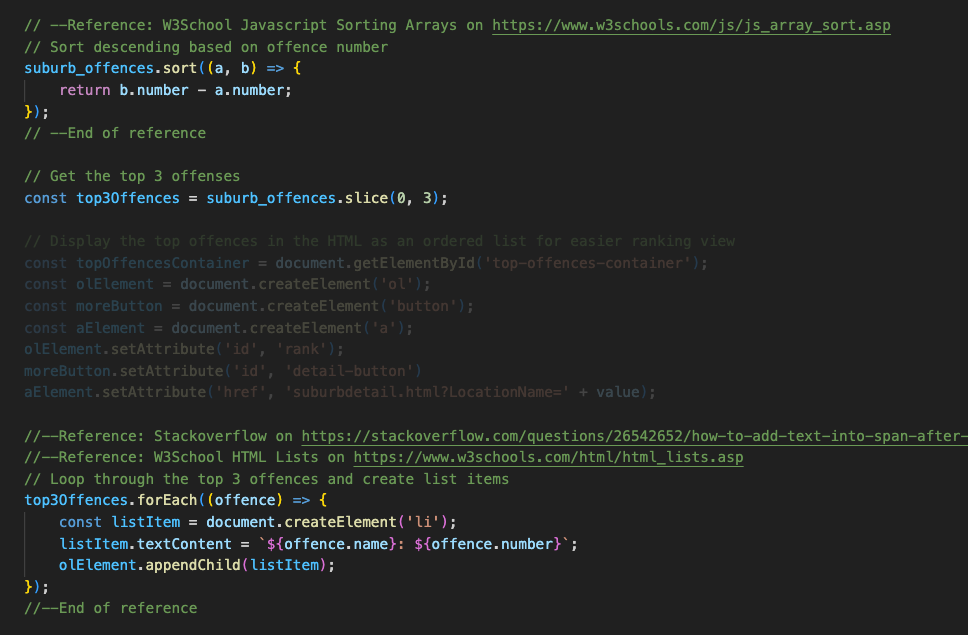
View more on my GitHub: https://github.com/ratnamukti/deco7180-interactivecrimemap/blob/main/suburblistscript.js
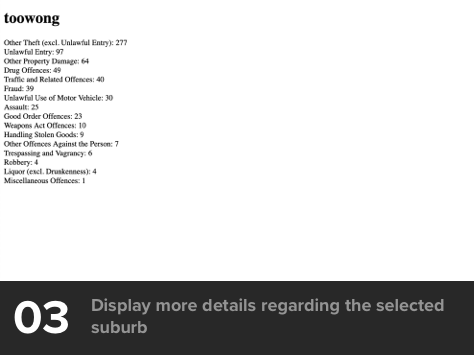
✅ Outcome

Step 3
Create Crime Details Page
I aimed to present more data when the user clicked ‘More Details’ on the pop-up. I will get the top 10 offences from the dataset and sort it descendingly.
The logic is pretty much the same as the one used to get the top 3 offences, but I fetch it in a different page instead of a pop-up.
Step 4
Create an Interactive choropleth map view of Brisbane
This final step aims to use OpenStreetMap to present the view of Brisbane on a map and make the suburb areas clickable as a substitute for buttons. I followed the documentation provided by LeafletJS and the Queensland Government’s API.
First, let’s show our Brisbane map. Here, I set the latitude and longitude that present the Greater Brisbane area. So, instead of showing the whole globe and needlessly scroll to the area that we code, I anchored the position right to where we are supposed to look at.

LeafletJS provided properties that we can customise as well, such as colours and tooltips. I just followed the code in LeafletJS documentation and turned:
Available areas into pink and
Geoboundaries of the suburbs into darker pink
Hovered area into yellow


The LeafletJS has a format using object to map
var statesData = {"type": "FeatureCollection", "features": []}
Then, using loop, add each index inside of my suburb array so that all of the suburbs I declared will be highlighted in the map and work interactively:
for (var i = 0; i < choosenSuburbs.length; i++) {
var url = 'https://a5c7zwf7e5.execute-api.ap-southeast-2.amazonaws.com/dev/locations?locationType=SUBURB&locationName='+ choosenSuburbs[i];
.
.
This would make the available suburbs into pink and clickable:

Final Results
Before

Focusing on fetching data from the API without OpenStreetMap or LeafletJS.
AFTER

Adding interactivity by implementing OpenStreetMap and LeafletJS.
FOR Future development
Automatically get all Brisbane areas without having to hardcode them into arrays. Sure, there’s an idea where I can loop the dataset containing the suburbs, but that would be for another day.
There is an issue where the geoboundaries of a suburb won’t show up because one or more suburbs contain the same substring (i.e., Milton, MiltonTown). A debugging effort has been made, and my conclusion after the trial was that the issue was pretty sure caused by the Queensland Government’s dataset. I could be wrong, but more debugging effort is needed.
Adding UI beautification, of course, but it is not the topic for this post.
References
Interactive Choropleth Map - Leaflet - a JavaScript library for interactive maps. (n.d.). Retrieved February 28, 2025, from https://leafletjs.com/examples/choropleth/
Queensland Government Open Data Portal. (2022, June 21). Crime locations last 5 years - API Document- Crime within geographical areas - Open Data Portal | Queensland Government. Retrieved February 28, 2025, from https://www.data.qld.gov.au/dataset/crime-locations-2000-present/resource/3a1448e0-649b-4b7c-813b-a5a5bb8ea14e
Using GeoJSON with Leaflet - Leaflet - a JavaScript library for interactive maps. (n.d.). Retrieved February 28, 2025, from https://leafletjs.com/examples/geojson/